
Current Resource Estimate
On September 16th, 2026 the company released a significant update to the 43-101 Resource Estimate on the property. Details are as follows:
- Indicated Resource of 48.7Mozs AgEq or 737Kozs AuEq: 21.0Mozs Ag, 210Kozs Au, 21Mlbs Cu , 55Mlbs Pb and 219Mlbs Zn
- Inferred Resource of 35.0Mozs AgEq or 529Kozs AuEq: 17.3Mozs Ag, 117Kozs Au, 21Mlbs Cu, 46Mlbs Pb and 188Mlbs Zn
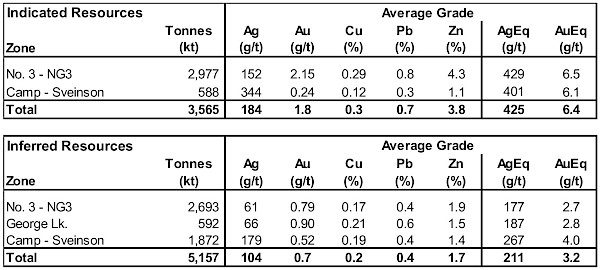
- The current Mineral Resource Estimate was prepared by Garth Kirkham, P.Geo., of Kirkham Geosystems Ltd and Eugene Puritch, P. Eng., FEC, CET and Fred Brown, P, Geo. of P&E Mining Consultants Inc. (“P&E”), Independent Qualified Persons (“QP”), as defined by National instrument 43-101.
- All Mineral Resources have been estimated in accordance with Canadian Institute of Mining and Metallurgy and Petroleum (“CIM”) definition standards for Mineral Resources and Mineral Reserves (May 2014), as referenced in NI 43-101.
- Mineral Resources were constrained using continuous mining stope shape units demonstrating reasonable prospects of eventual economic extraction.
- Silver and Gold Equivalents were calculated from the interpolated block values process recoveries, payables and prices between the component metals and silver to determine a final AgEq and AuEq values.
- Silver and Gold Equivalents and NSR C$/t values were calculated using average long-term prices of $38/oz silver, $3,200oz gold, $4.75/lb copper, $0.95/lb lead and $1.35/lb zinc. All metal prices are stated in $USD. The C$122/tonne NSR cut-off value for the underground Mineral Resource was derived from mining costs of C$85/t, with site process costs of C$25/t and G&A of C$12/t. Process recoveries from 2022 metallurgical test work were Au 55%, Ag 80%, Cu 80%, Pb 81% and Zn 90%. Concentrate freight, smelting and refining costs were also included.
- Grade capping was performed on 1m composites for the No. 3 and NG-3 Veins and whole vein composites for the Camp and Sveinson Veins. For the No. 3 and NG-3 Veins Inverse distance cubed (I/d3) was utilized for grade interpolation for Au and Ag and inverse distance squared (I/d2) was utilized for Cu, Pb and Zn. Inverse distance squared (I/d2) was used for all metals in the Camp Vein while ordinary kriging was employed for the Sveinson Veins.
- For tonnage calculations in the No. 3 and NG-3 veins the median bulk density by vein was applied, with an average of 3.36 tonnes per cubic metre overall. A variable bulk density with a 3.15 tonnes per cubic metre average was used for the Camp and Sveinson Veins.
- Mineral Resources are not Mineral Reserves until they have demonstrated economic viability. Mineral Resource Estimates do not account for a Mineral Resource’s mineability, selectivity, mining loss, or mining dilution. Underground stope shape optimization internal dilution has been included.
- Mineral Resources that are not Mineral Reserves do not have demonstrated economic viability. Inferred Resources are considered too speculative geologically to have economic considerations applied to them that would enable them to be classified as Mineral Reserves.
- An Inferred Mineral Resource has a lower level of confidence than that applying to an Indicated Mineral Resource and must not be converted to a Mineral Reserve. It is reasonably expected that the majority of Inferred Mineral Resources could be upgraded to Indicated Mineral Resources with continued exploration.
- All figures are rounded to reflect the relative accuracy of the estimate and therefore numbers may not appear to sum precisely.
Overview
The Silver Queen gold-silver property consists of 17 crown-granted and 46 tenure claims covering 18,870.71 hectares in the Omineca Mining Division, south of Houston, British Columbia. The property is located on the all season maintained road to Huckleberry mine at Owen Lake - 43 km south of Houston BC. Located in the heart of the Skeena Arch and surrounded by current and past producing mines as well as advanced exploration projects for large mining companies, there is excellent potential for discovery and delineation of a productive deposit.
On July 16th, 2019, the company released a maiden NI 43-101 Resource Estimate of 85Kozs Au, 5.2Mozs Ag, 5Mlbs Cu, 17Mlbs Pb and 114Mlbs Zn (244,000oz AuEq) Indicated and 64Kozs Au, 4.7Mozs Ag, 5Mlbs Cu, 16Mlbs Pb and 92Mlbs Zn (193,000oz AuEq) Inferred. Click here for a summary table of the resource and click here for the full technical report. This resource has been significantly expanded since then, with the latest resource released on September 16th 2026 containing 210Koz Au, 21.0Moz Ag, 21Mlbs Cu, 55Mlbs Pb and 219Mlbs Zn (737Koz AuEq) Indicated and 117Koz Au, 17.3Moz Ag, 21Mlbs Cu, 46Mlbs Pb and 188Mlbs Zn (529Koz AuEq.)
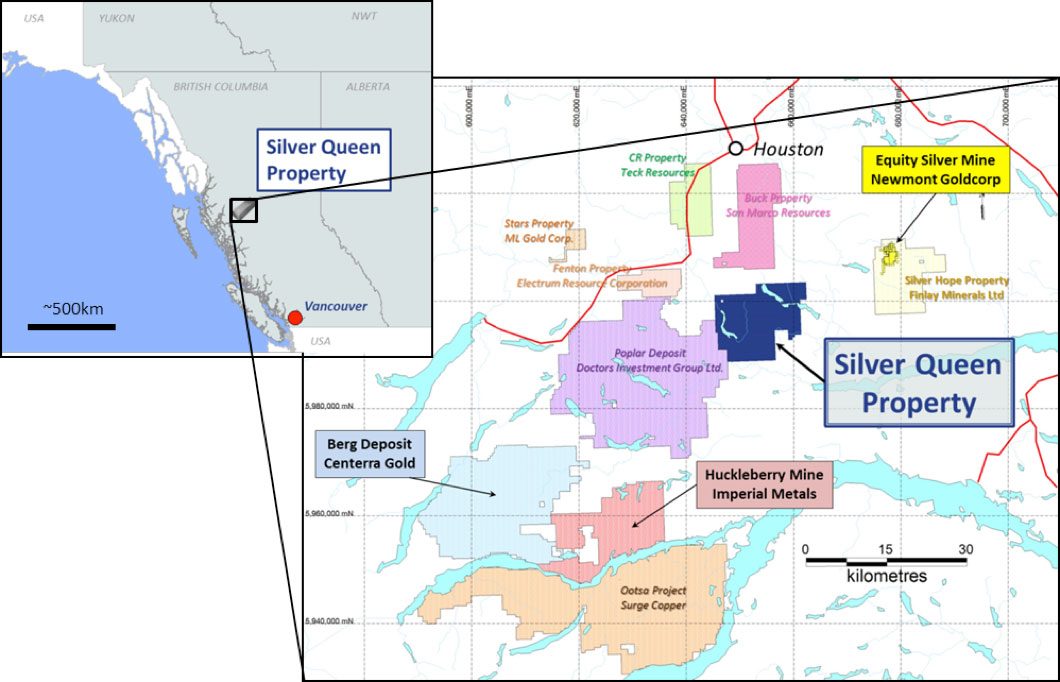
Figure 1 - Location and Infrastructure of the Silver Queen Property along with Nearby Deposits and Mines
History: 1912 - Present
Mineralization on the property was discovered in 1912. Since then, over 500 drillholes as well as >9km of underground workings have been conducted on the property. Since discovery, more than $20 million has been spent on the property. Table 1 is a brief summary of the historic work. For a more detailed description of historical work, see the technical report filed on SEDAR or on the company’s website.
Table 1 - Summary of Historic Exploration on the Silver Queen Property
| Year | Summary of Work |
|---|---|
| 1912 | Mineralization discovered on the property |
| 1912-1947 | 1,000m of underground workings developed, 38 tons of mineralization shipped |
| 1963-1971 | Property explored by Nadina Explorations limited, intermittently optioned to partners, 2500m of underground workings and >4,500m of drilling conducted |
| 1972-1974 | Property put into production by the Bradina Joint Venture, 200kt milled; ~10,000m of drilling |
| 1977-1985 | Nadina (reorganized as New Nadina in 1980) and various partners conducted trenching, metallurgy and >5,000m of drilling |
| 1985-1990 | Pacific Houston optioned the property and conducted metallurgy, 2500m of underground workings and ~10,600m of drilling |
| 1990-2018 | New Nadina surface exploration, surface and airborne geophysics and ~20,000m of drilling |
| 2019- | Equity Metals Corporation: New Management, New Name, New Direction |
Although the property has been extensively explored in the past, previous exploration programs mostly focussed on either large scale grass-roots discovery drilling or small-scale expansion of resources with closely spaced drilling to “feed the mill.” Current management plans to evaluate the data in a much more systematic manner with a new focus on prioritizing property wide targets and aggressively offsetting the primary targets with the goal of very quickly expanding on the initial NI 43-101 Mineral Resource Estimate.
Regional Geology
West-central British Columbia lies within the Stikine Terrane, that includes: Late Triassic Takla Group submarine calc-alkaline to alkaline, immature, volcanic-arc rocks; Early to Middle Jurassic Hazelton Group sub-aerial to submarine, calc-alkaline volcanic, volcaniclastic and sedimentary rocks; Late Jurassic and Cretaceous successor basin sedimentary rocks of the Bowser Lake, Skeena and Sustut groups; and Cretaceous to Tertiary calc-alkaline continental volcanic arc rocks of the Kasalka, Ootsa Lake and Endako groups (MacIntyre and Desjardins, 1988), shown in Figure 2. Plutonic rocks of Jurassic, Cretaceous and Tertiary age form distinct intrusive belts (Carter. 1981), with associated porphyry copper, stockwork molybdenum and mesothermal and epithermal base and precious metal veins.
Stratified Cretaceous rocks hosting the polymetallic epithermal veins on the Silver Queen Property and the Equity Silver Deposit are considered to be correlative with the Cretaceous Kasalka Group rocks (Church 1971).
The Kasalka Group is a late-Early Cretaceous (Armstrong, 1988) or early-Late Cretaceous (MacIntyre, 1985) continental volcanic succession that is predominantly porphyritic andesite and associated volcaniclastic rocks. It is well exposed in the Kasalka Range type section near Tahtsa Lake. In the type area, it includes a basal polymictic conglomerate with lenses of sandstone that lies in angular unconformity on older rocks. The conglomerate is overlain by a felsic fragmental unit over 100 m thick, consisting of variably welded siliceous pyroclastic rocks (lithic lapilli tuff, crystal and ash-flow tuff, minor breccia) with interbedded porphyritic flows. The fragmental rocks are in turn overlain by columnar jointed, massive, greenish grey flows or sills of hornblende-feldspar-porphyritic andesite to dacite that are at least 100 m thick. The andesite flows are conformably overlain by a 200 m thick assemblage of volcanic debris flows (lahars). Rhyolite flows and tuffs and columnar jointed basalt flows, together more than 100 m thick, cap the succession.
The Silver Queen Property is located on the western perimeter of the Buck Creek basin that is delineated by a number of rhyolite outliers and semicircular alignment of Upper Cretaceous and Eocene volcanic centres scattered between Francois Lake, Houston and Burns Lake. The Buck Creek basin is interpreted as a resurgent caldera (Leitch et al. 1992). The past-producing Equity Silver Mine is located within a window eroded into the central uplifted area (Church, 1985). A prominent lineament 30 km long trends east-northeast from the Silver Queen Property towards the central uplift hosting the past-producing Equity Silver Mine and appears to be a radial fracture coinciding with the eruptive axis of the Tip Top Hill (Kasalka Group) volcanics and a line of syeno-monzonite stocks and feeder dykes to an assemblage of “moat” volcanics (Church, 1985; Leitch et al. 1992). Block faulting is common in the basin, locally juxtaposing the various ages of volcanic rocks found within it.
Within the basin, a Mesozoic volcanic assemblage is overlain by a Tertiary volcanic succession. The oldest rocks exposed within the basin are at the Equity Silver and Silver Queen properties. The sequence at the Equity mine has been characterized by Church (1984) as the Lower Jurassic Telkwa Formation of the Hazelton Group, however, Wetherell et al. (1979) and Cyr et al. (1984) correlate the sequence hosting the Equity orebodies with the Upper Cretaceous Kasalka Group.
Upper Cretaceous rocks with similarities to the Kasalka Group are exposed westwards from the Equity Silver Mine to the Owen Lake area, where they host the Silver Queen Deposit (Church, 1984). These rocks have been dated at 75-80 Ma by K-Ar whole rock (Church, 1973).
The Upper Cretaceous rocks are overlain by the Eocene Ootsa Lake Group which includes the Goosly Lake and Buck Creek Formations of Church (1984). The Goosly Lake andesitic to trachyandesitic volcanic rocks are dated at 48.8 ± 1.8 Ma by K-Ar whole rock, and this is supported by dates of 49.6 ± 3.0 to 50.2 ± 1.5 Ma for related syenomonzonite to gabbro stocks with distinctive bladed plagioclase crystals (Church, 1973) at Goosly and Parrot lakes. The Buck Creek andesitic to dacitic volcanic rocks, which directly overlie the Goosly Lake Formation, are dated at 48.1 ± 1.6 Ma by K-Ar whole rock. Basalts of the upper part of the Buck Creek Formation (Swans Lake member: Church, 1984) may correlate with the Endako Group of Eocene-Oligocene age. These rocks give whole rock K-Ar ages of 41.7 ± 1.5 to 31.3 ± 1.2 Ma on samples from the Whitesail Lake map area (Diakow and Koyanagi, 1988). The youngest rocks in the Buck Creek basin are Miocene columnar olivine basalt, called the Poplar Buttes Formation by Church (1984) and dated at 21.4 ± 1.1 Ma by K-Ar whole rock (Church, 1973).
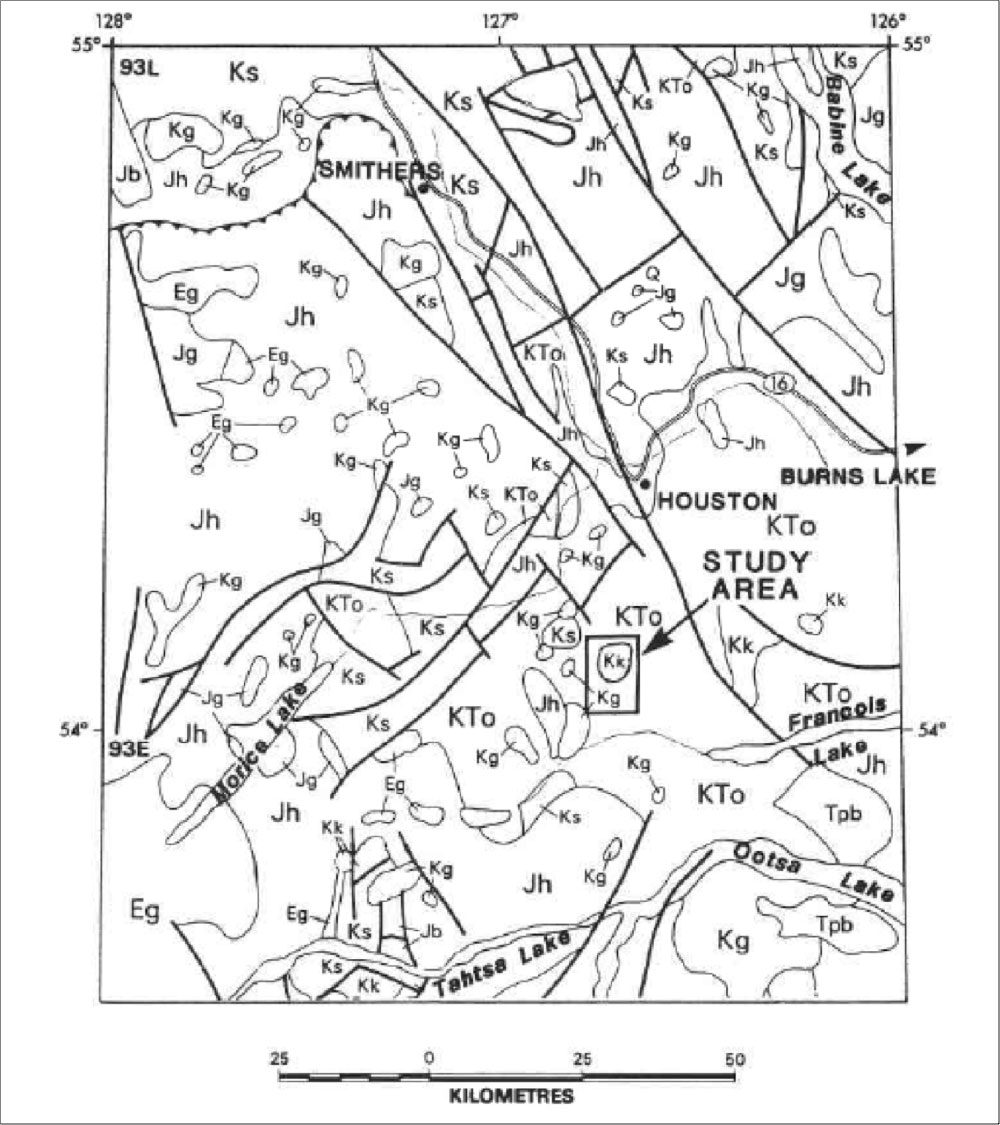
Figure 2 - Regional Geology of the Silver Queen Property Area (Source: Leitch et al. 1992)
Legend
| Tpb, Tertiary plateau basalt; | Eg, Eocene granite; |
| KTo, Ootsa Lake Group; | Kg, Cretaceous granite; |
| Kk, Kasalka Group; | Ks, Skeena Group; |
| Jg, Jurassic granite; | Jh, Hazelton Group. |
| Source: Leitch et al. (1992). | |
Property Geology
The stratigraphy of the area surrounding the Silver Queen Mine shows a stratigraphic succession that is similar to that observed in the Kasalka Range (Leitch et al. 1992). Leitch et al. (1992) subdivides the rocks on the Silver Queen Property into five major stratified units plus three types of dykes (Figure 5). The following descriptions taken are from Leitch et al. (1992).
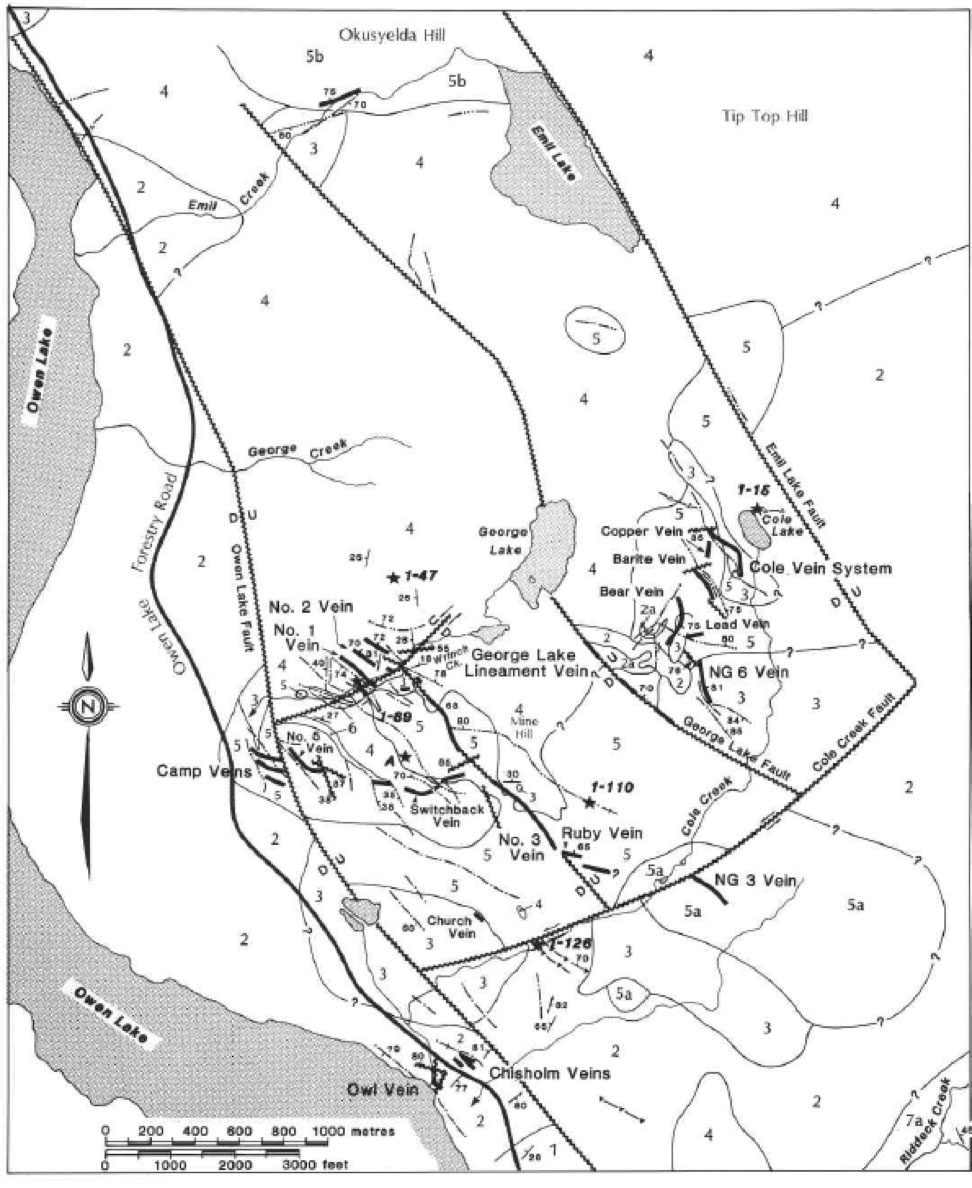
Figure 3 - Property Geology (Source: Leitch et al. 1992)
Note: Numbers correspond to units described in text.
Source: Leitch et al. (1992)
A basal reddish purple polymictic conglomerate (Unit 1), is overlain by fragmental rocks ranging from thick crystal tuff (Unit 2) to coarse lapilli tuff and breccia (Unit 3), and this is succeeded upwards by a thick feldspar-porphyritic andesite flow unit (Unit 4), intruded by micro-diorite sills and other small intrusions (Unit 5). Coarsely porphyritic feldspar porphyry (Unit 5A) outcrops to the south which appears to be the subvolcanic source of the rocks of Unit 4 and of Unit 5. The stratified rocks form a gently northwest-dipping succession, with the oldest rocks exposed near Riddeck Creek to the south and the youngest exposed in Emil Creek to the north.
All of the stratified units are cut by dykes that can be divided into three groups: amygdaloidal dykes (Unit 6), bladed feldspar porphyry dykes (Unit 7), and diabase dykes (Unit 8). The relationships between units 1 through 8 are shown in Figure 4. Epithermal vein mineralization at Silver Queen occurs between unit 6 and unit 7. The age of the porphyry mineralization is as yet undetermined, although it occurs predominantly within unit 5a.
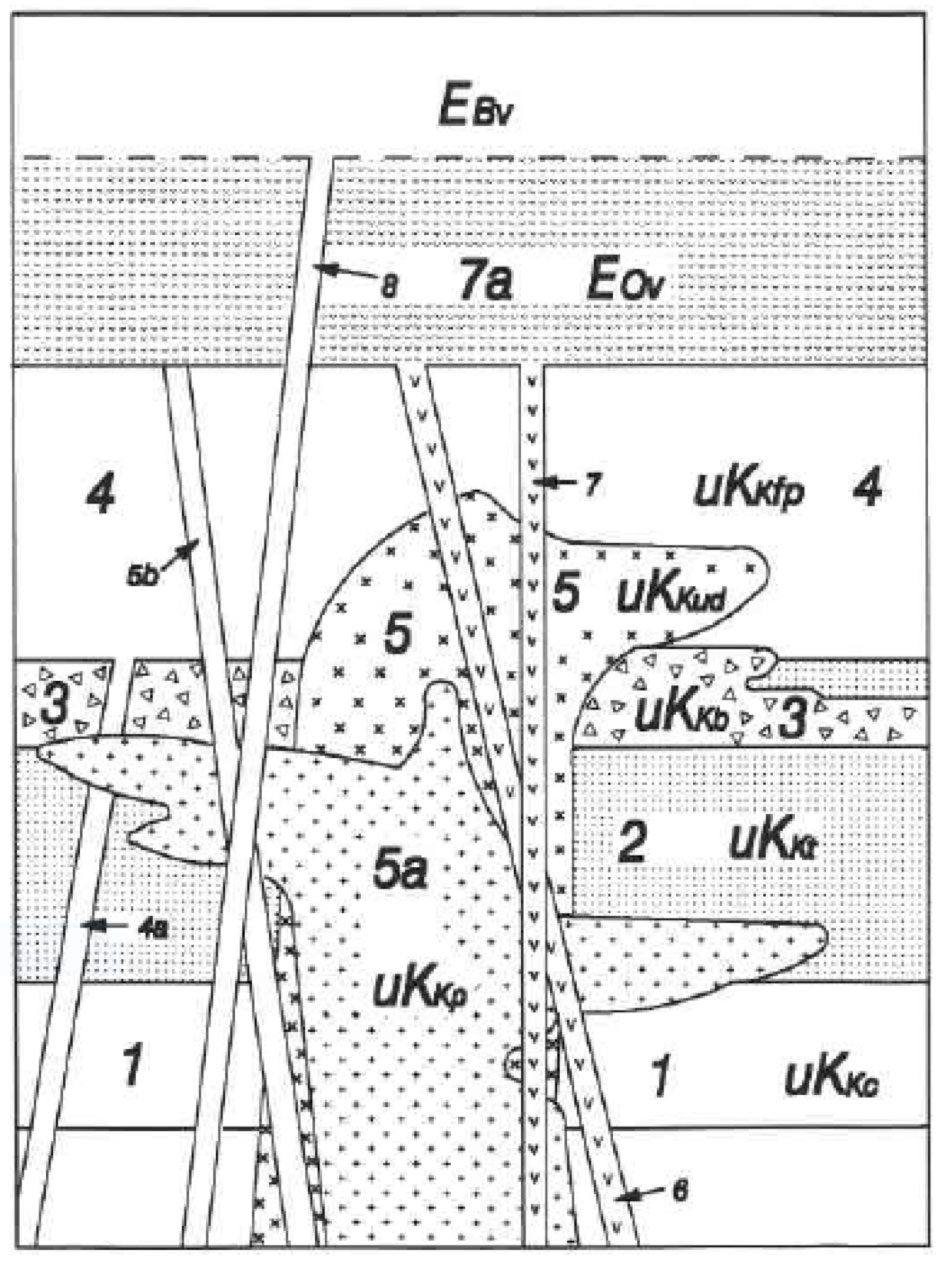
Figure 4 - Schematic relationships between geological units on the Silver Queen Property
Note: Unit numbers correspond with units described in text.
Source: Leitch et al. (1992)
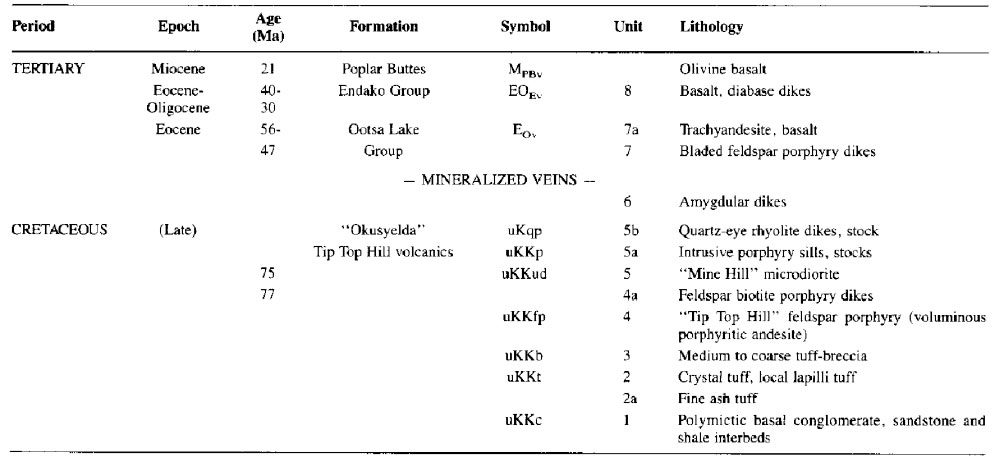
Figure 5 - Legend for Figures 2 and 3
Deposit Types
Two different deposit types have been identified on the property. The “Itsit Porphyry” contains Chalcopyrite and Molybdenite in a quartz-stockwork zone with up to 4 phases of veining, within feldspar porphyry, tentatively correlated with Unit 5a.
High-grade epithermal Au-Ag veins with varying abundances of base metals (Cu-Pb-Zn) cut the Late Cretaceous volcanic sequence. Over 20 individual veins have been identified on the property to date which display a regional-scale zoning ranging from Au-Ag-enriched in the western part of the property to more base metal-enriched in the eastern part of the property.
Primary Target High-grade Au-Ag-Zn Epithermal Vein system
The Epithermal Vein system on the Silver Queen Property was the first mineralization discovered and has been the target of the majority of exploration since. Of the more than 20 veins discovered on the property, three targets have now been drilled and are part of the latest 43-101 resource estimate. All three targets are still open along strike and down dip .Figure 6 is a map showing the location of the main targets for future exploration programs.
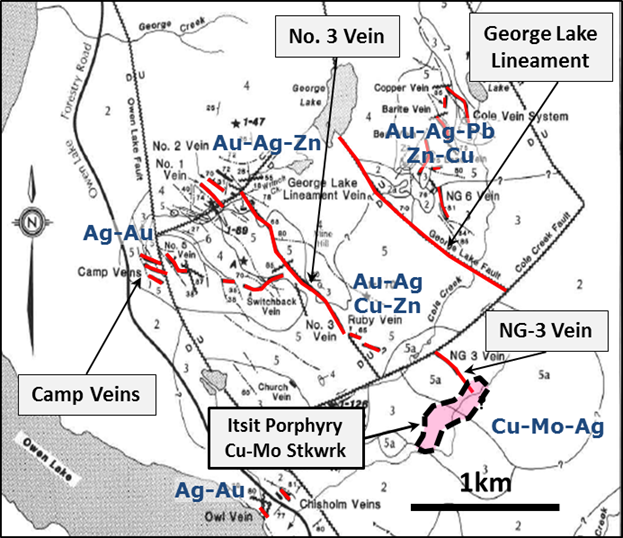
Figure 6 - Location of some of the main targets on the Silver Queen Property
Secondary Target - Itsit Porphyry Cu-Mo-Ag-Au Deposit
The Itsit Porphyry deposit was discovered in drilling following the identification a large chargeability anomaly in a Titan 24 DCIP geophysical survey in 2011-12. The current deposit is defined as a Cu-Mo quartz stockwork zone located several hundred metres to the southeast of the No. 3 Vein and is intersected in seven drill holes over a 300 metre strike-length. The stockwork zone occurs along the northwestern margin of a large 1000m x 500m x 300m chargeability anomaly which has been only partially tested with roughly 600 metres of strike-length, along this specific, trend remaining to be tested. Similar Cu-Mo quartz stockwork mineralization was also intersected in drill hole 12S-01 approximately 300 metres to the south of the main stockwork area and within the main part of the chargeability anomaly suggesting a much more widespread mineral potential in the Cu-Mo porphyry target.
Four generations of veining have been identified in the quartz stockwork which is strongly Cu and Mo enriched with generally >1g/t Ag values. Mineralization was tested to over 800 metres depth and most holes ended in strongly elevated to anomalous Cu-Mo-Ag mineralization. Higher Au-Ag mineralization was identified in drill hole 12S-05 which returned a 126m interval averaging 0.43g/t Au, 87.8g/t Ag, 0.29% Cu and 0.05% Mo and included two higher-grade vein intercepts of 5.5m averaging 3.15g/t Au, 1,581g/t Ag and 1.25% Cu and 3m averaging 5.9g/t Au, 268g/t Ag and 0.31% Cu.
Two target concepts have been identified within the porphyry system including the immediate lateral extensions of the main porphyry Cu-Mo stockwork zone and a sub-target developed around the intersection of the Cu-Mo stockwork with the Au-Ag epithermal vein system:
Porphyry Target: 400 - 500Mt @ 0.3% Cu, 0.04%Mo with Au and Ag credits (iii)
Sub-target: 25-50Mt @ 0.4g/t Au, 80g/t Ag, 0.3% Cu and % 0.05% Mo
Much more drilling is required on the Itsit Cu-Mo Prophyry Target which remains at this time a secondary target objective of the Company.
Table 5: Select Mineral intercepts from the Itsit Porphyry target
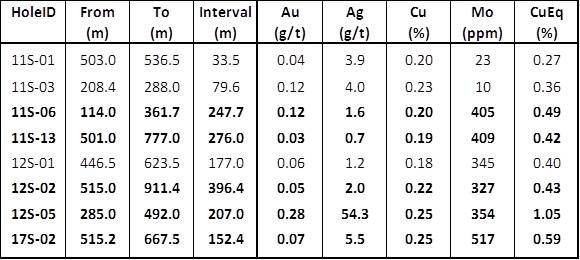
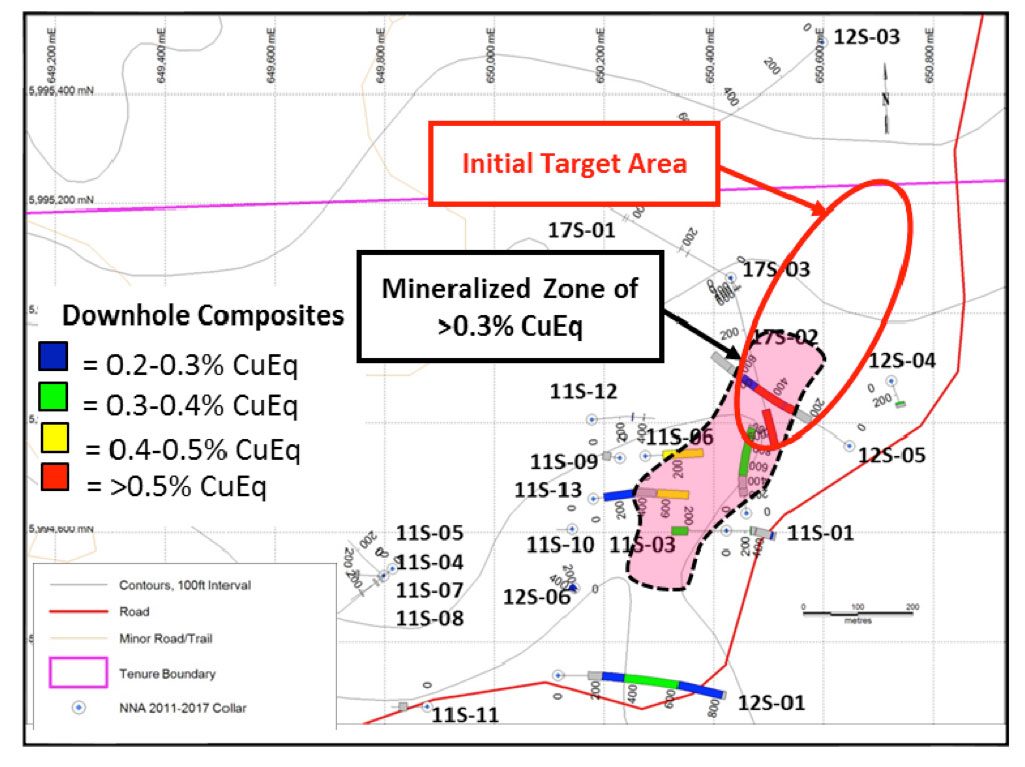
Figure 10 - Plan map of the “Itsit Porphyry” area with CuEq grades and drillholes labelled
- The exploration target consists of 3.0-5.0Mt grading 2-4g/t Au, 150-200g/t Ag, 0.2-0.4% Cu, 0.8-1.0% Pb and 5-7% Zn, is based on data from >500 drillholes drilled on the property, is conceptual in nature and relies on projections of mineralization that are beyond the standard CIM classification of mineral resources and should not be relied on as a mineral resource estimate. It is uncertain whether additional exploration will result in the target being delineated as a mineral resource.
- This exploration target is contained within the property wide exploration target, which consists of 3-5Mt grading 2-4g/t Au, 150-200g/t Ag, 0.2-0.4% Cu, 0.8-1.0% Pb and 5-7% Zn, is based on data from >500 drillholes drilled on the property, is conceptual in nature and relies on projections of mineralization that are beyond the standard CIM classification of mineral resources and should not be relied on as a Mineral Resource Estimate. It is uncertain whether additional exploration will result in the target being delineated as a mineral resource.
- The exploration target consists of 400-500Mt grading 0.2-0.3% Cu, 0.03-0.05% Mo, 1-3g/t Ag and 0.05-0.15g/t Au, is conceptual in nature and relies on projections of mineralization that are beyond the standard CIM classification of mineral resources and should not be relied on as a mineral resource estimate. The target is based on wide intercepts (>100m) of Cu-Mo-Ag-Au mineralization intersected in 2011-2017 drilling. It is uncertain whether additional exploration will result in the target being delineated as a mineral resource.
Environmental and Permitting
The Silver Queen Property is within the Wet’suwet’en territory and the First Nation is included in the Notice of Work and permitting consultation process. Equity Metals will actively encourage First Nation involvement and will use qualified First Nations’ employees and contractors in all activities when available.
The Silver Queen site is considered a “brownfield” site as a result of previous mining and mineral processing activity during 1972-1973 and extensive exploration over many decades. The British Columbia environmental assessment and permitting processes are well defined and are expected to proceed smoothly. A Best Practices Mine Closure Plan will be outlined and implemented that will result in minimal site long-term liabilities.
Click here for the Equity Metals Corporation Silver Queen Property COVID-19 Protocol
Reference List
The following is a list of the references cited above as well as other background reading for the Silver Queen Project: Armstrong, R.L. (1988): Mesozoic and Early Cenozoic Magmatic Evolution of the Canadian Cordillera; Geological Society of America. Special Paper 218, pages 55-91.
Caron, L., (1996): Final Technical Report; 1995-1996 Compilation and Interpretation of Data and Metallurgical Program.
Carter, N.C. (1981): Porphyry Copper and Molybdenum Deposits West-central British Columbia; B.C. Ministry of Energy, Mines and Petroleum Resources, Bulletin 64, 150 pages.
Cheng, X., (1995): Mass Changes During Hydrothermal Alteration, Silver Queen Deposit, Ph.D. Thesis.
Church, B.N. (1970): Nadina (Silver Queen); B.C. Ministry of Energy, Mines and Petroleum Resources, Geology, Exploration and Mining, 1969, pages 126-139.
(1971): Geology of the Owen Lake, Parrot Lakes, and Goosly Lake Area; B.C. Ministry of Energy, Mines and Petroleum Resources, Geology, Exploration and Mining, 1970, pages 119-127.
(1973): Geology of the Buck Creek Area; B.C. Ministry of Energy, Mines and Petroleum Resources, Geology, Exploration and Mining, 1972, pages 353-363.
(1984): Geology of the Buck Creek Tertiary Outlier; B.C. Ministry of Energy, Mines and Petroleum Resources, unpublished 1:100 000 scale map.
(1985): Update on the Geology and Mineralization in the Buck Creek Area - the Equity Silver Mine Revisited (93L1W); B.C. Ministry of Energy, Mines and Petroleum Resources, Geological Fieldwork 1984, Paper, 1985-1, pages 175-187.
Cyr, J.B., Pease, R.B. and Schroeter, T.G. (1984): Geology and Mineralization at the Equity Silver Mine; Economic Geology, Volume 79, pages 947-968.
Diakow, L.J. and Koyanagi, V (1988): Stratigraphy and Mineral Occurrences of Chikamin Mountain and Whitesail Reach Map Areas(93E/06, 10); B.C. Ministry of Energy, Mines and Petroleum Resources, Geological Fieldwork 1987, Paper, 1988-1, pages 155-168.
Duffell, S. (1959): Whitesail Lake Map-area. British Columbia: Geological Survey of Canada. Memoir 299.
Giroux, G.H. (2012) 2012 Mineral Resource Update on the Poplar Deposit, Omineca Mining Division, British Columbia, NI43-101 Technical Report for Lions Gate Metals Inc., March 30, 2012, 129 p.
JDS Energy and Mining Inc. (2011) Technical Report for the Silver Queen Property, for New Nadina Explorations Limited, April 18, 2011, 97 p.
Leitch. C.H.B., Hood, C. T., Xiao-Lin Cheng, and Sinclair, A.J. (1992): Tip Top Hill volcanics: Late Cretaceous Kasalka Group rocks hosting Eocene epithermal base- and precious-metal veins at Owen Lake, west-central British Columbia, Canadian Journal of Earth Sciences, Vol. 29, pp. 854-864.
Panteleyev, A. (1986). Ore Deposits #10, A Canadian Cordilleran Model for Epithermal Gold-Silver Deposits, Geoscience Canada, Vol. 13, No.2, pp. 101-111.
Wetherell, D.G., Sinclair, A.J. and Schroeter, T.G. (1979): Preliminary Report on the Sam Goosly Copper-silver Deposit; B.C. Ministry of Energy, Mines, and Petroleum Resources, Geological Fieldwork 1978, Paper, 1979-1, pages 132-137.
Wojdak, P.J. and Sinclair, A.J. (1984): Equity Ag-Cu-Au Deposit: Alteration and Fluid Inclusion Study; Economic Geology, Volume 79, pages 969-990.